SEO-friendly infographics have amazing shareability and link-building potential. They use text and graphics to explain complex ideas and concepts with ease. That’s why people find them interesting and share infographics with their contacts three times more than any other content format.
However, to unleash their true potential, you’ve got to optimize the infographics for SEO. Building an SEO infographic is a little different from optimizing other blogs or articles for search engines.
Technically they are just like any other image files, but they also contain helpful information in text form. Previously Google viewed them as simple image files, and you’d optimize them just like you would do for any other image.
Today Google can read text on the images just like it can read any text-based content.
You spotted it! Starting this month, we’re rolling out the ability to search your photos by the text in them.
Once you find the photo you’re looking for, click the Lens button to easily copy and paste text. Take that, impossible wifi passwords 😏
— Google Photos (@googlephotos) August 22, 2019
Of course, this has significantly altered the way SEO for infographics should proceed. Unfortunately, many marketers and SEO experts are still not considering this change during optimization and are following old methods of building SEO infographics.
So, let’s discuss the right way to SEO infographics and ensure greater visibility for them in the SERPs.
1. Know Your Linkable Audiences
It’s crucial to design an infographic with linkable audiences in mind from the very beginning, particularly if you wish to use it for link-building. Even when you do everything right, if your audience isn’t super keen on infographics, it will not succeed in getting any traction, much less win any links.
That’s why you must spot linkable audiences in your niche and design your infographic around those audience segments.
Business, sustainability, lifestyle, pets, and productivity are all favorable audiences for infographics. On the other hand, beauty, fashion, and high-end news channels aren’t super receptive to infographics. Instead, they prefer checklists, printables, surveys, and studies.
When an infographic is created for linkable audiences, it’s easier to distribute it and reach out to the influencers in the market. Since they like infographics, if your topic is relevant to them, they’ll be happy to share your content and link to it.

2. Do Your Research
Once you know you’ve pinned down your audience, it’s time to research their likes and dislikes thoroughly. Discover what worries them, what they aspire to, and what moves them to action.
Choose Topics of Audience Interest
Getting to know your audience allows you to choose an infographic topic that will interest the audience. People will link to your infographics only if it engages them or their audience. No matter how informative and actionable an infographic is, if the audience doesn’t care about it, it won’t have any luck winning links.
You can choose a topic from an existing blog post, add more statistics and actionable advice, display all of it in visual form. Or, you can start from scratch and pick a topic that your audience wants to know more about.
For example, if you’re a real estate company, your audience might like infographics on the cost of selling a house, real estate hacks to get the most value out of a transaction, or anything home-related, really!
Make sure to focus on only one main topic for one infographic. Don’t cram the infographic with too many ideas or make it so broad that none of your target audiences will find it relevant.

Choose a Voice and Style
Your choice of voice and style should depend on two factors:
- Your brand voice and style.
- Your audience expectations.
Every niche has its tone. For example, business websites typically use an authoritative tone to showcase credibility. Conversely, lifestyle blogs have an easygoing tone to give off friendly vibes. Chime in your brand personality, and you’ll find the perfect voice and style for your infographic.
3. Finalize Keywords for Your SEO Infographic
Although infographics are visual content, it’s important to optimize them for a keyword with ranking potential. Google isn’t image-blind anymore. It can read text on images and recognize the context of your graphics through the keywords in them.
Therefore, it would be counterintuitive to build an SEO infographic without focusing on a primary keyword related to your topic. After all, if no one’s searching for it, your infographic will have no audience. The chosen keyword will also guide your optimization strategy and the storyline for your visual.
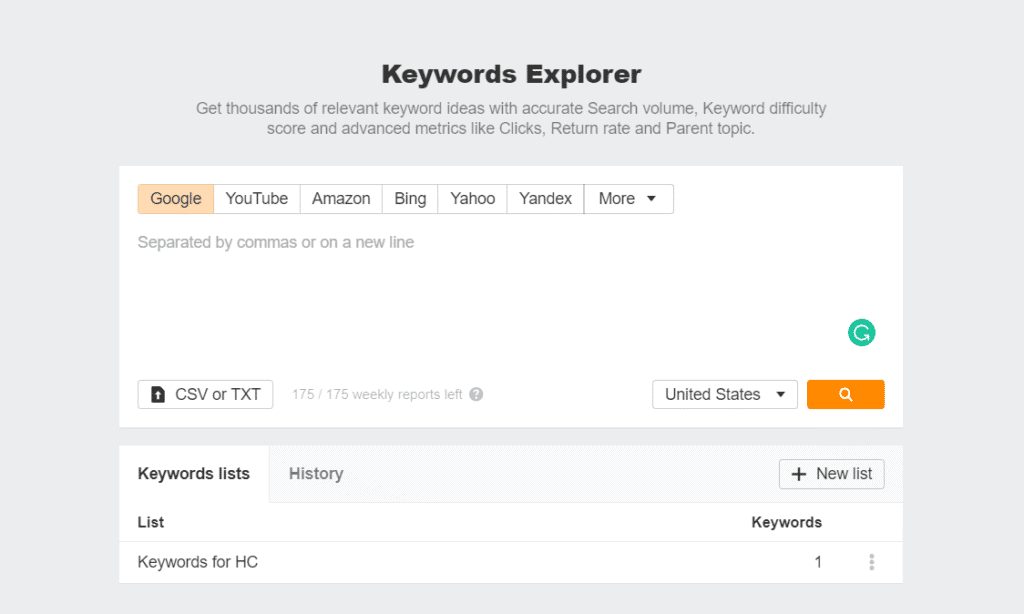
You can use any keyword research tool like Ahrefs or Moz to find relevant keywords. However, it’s best not to rely on the search volume and clicks blindly. Instead, notice the search intent of the keyword and figure out whether an infographic in response to the keyword will be able to rank or not. For example, is it something the audience expects when they search for this keyword?
The challenge is to find the right keyword, one that will rank and still be relevant to your niche and target audience.
4. Make It Engaging and Informative
People have a very short attention span nowadays. So if you don’t grab their attention and engage them with informative content immediately, you’ll lose them in the blink of an eye.
Follow the SUCCESS Model to make your infographic idea stick with the audience.
- Simple: Keep your infographic simple!
- Unexpected: Add new information that excites your audience.
- Concrete: Don’t be vague about your ideas and information.
- Credible: Always back your claims with authentic sources.
- Emotional: Make sure your infographic relates to the audience emotionally.
- Stories: Let your narrative flow like a story.
- Sharable: Make sure your infographic is interesting and prompts your audience to want to share it.

Come Up With a Compelling Narrative
Gather all the information you have on the topic you wish to add to your infographic and arrange it to flow like a story. A story has a start, a middle, and an end. Similarly, your infographic should tell a story visually, with each piece of information paving the way for the next one.
Instead of placing random information, there should be a central narrative for your infographic. Arrange all the information to support the narrative and create a compelling argument. You can add humor to keep your audience interested and statistics to make your content trustworthy and concrete.
Include Actionable Advice
The storyline of your infographic will keep your audience with you, but they’ll link and share it only if it benefits them somehow. Here, we go back to the search intent of your topic keyword.
What is your audience trying to learn from the infographic? Readers are always looking for actionable advice when they search for something on the internet. They require concrete solutions to their problems. Ensure your infographic not only presents information but also tells them how to use it to improve their situation or solve their problem.

5. Design a Share-worthy Infographic
Design plays a crucial role in building an SEO infographic that sells like hotcakes. Specific design elements, proportions, negative space, and color psychology all contribute to making your infographic memorable and persuasive.
Design To Support the Storyline
There are many different types of infographics, and none is better than the other. Each infographic type has its purpose. Your job is to select the right design that supports your storyline.
The infographic design also depends on the type of data you’re going to feature in your infographic. For example, if you have statistical data, it’s a good idea to include charts, pictograms, and geometrical shapes. On the other hand, if your content is informational, you can use icons to represent different points you mention.
Use On-brand Design Features
Like any other aspect of your content, infographics should include on-brand design features that tie them to your brand’s overall look and personality. Here are a few features to keep in mind:
- Use your logo in the infographic.
- Make sure to use branded colors.
- Supporting graphics should match branded imagery.
- Don’t forget to match typography.
It’s best to stick to basic branded colors and two to three font styles only; otherwise, your infographic will lose its appeal and look overwhelming and crowded.
Interactive Infographics
Sometimes when you’re working with a complex set of data and information, creating an interactive infographic makes more sense. Interactive infographics are highly engaging and can earn you a ton of backlinks for a very long time.
Here’s an interesting interactive infographic about the New York Skyline.
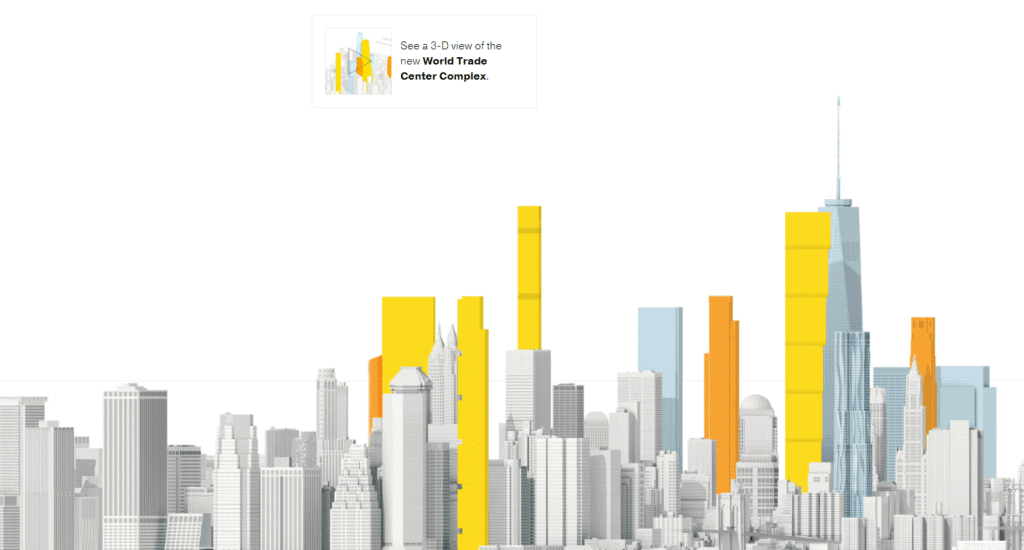
On the downside, they require a lot of resources and skilled graphic designers to create compelling interactive infographics.
6. Create a Balanced Infographic
The success of infographics as link magnets depends on their ability to present complex information in a captivating way. They use a balanced mix of text and graphics to deliver a dull or complex topic in engaging and easy-to-understand chunks.
That’s why if you wish to build an SEO infographic that attracts hundreds of links, you must ensure a creative mix of text and graphical elements. Single out the main points covered in the infographic and identify their supporting data. Remove everything that’s not directly related to the main points.
Here’s what you can do to ensure that your infographic isn’t dull or overbearing.
- Don’t add too much information, or your audience may feel overwhelmed.
- Keep the text short and crisp as a page full of text can make readers lose interest.
- Highlight the important messages by using graphic elements or unique typography.
- Don’t use too many design elements as they can be distracting.
This infographic we created is simple and clean with just enough words to convey the message.

7. Optimize Infographic Text
Since Google can read text on your infographic, it’s crucial to optimize it for search engines along with the search intent of your audience. The optimization of text on infographics will follow the guidelines for blog post optimization to some extent.
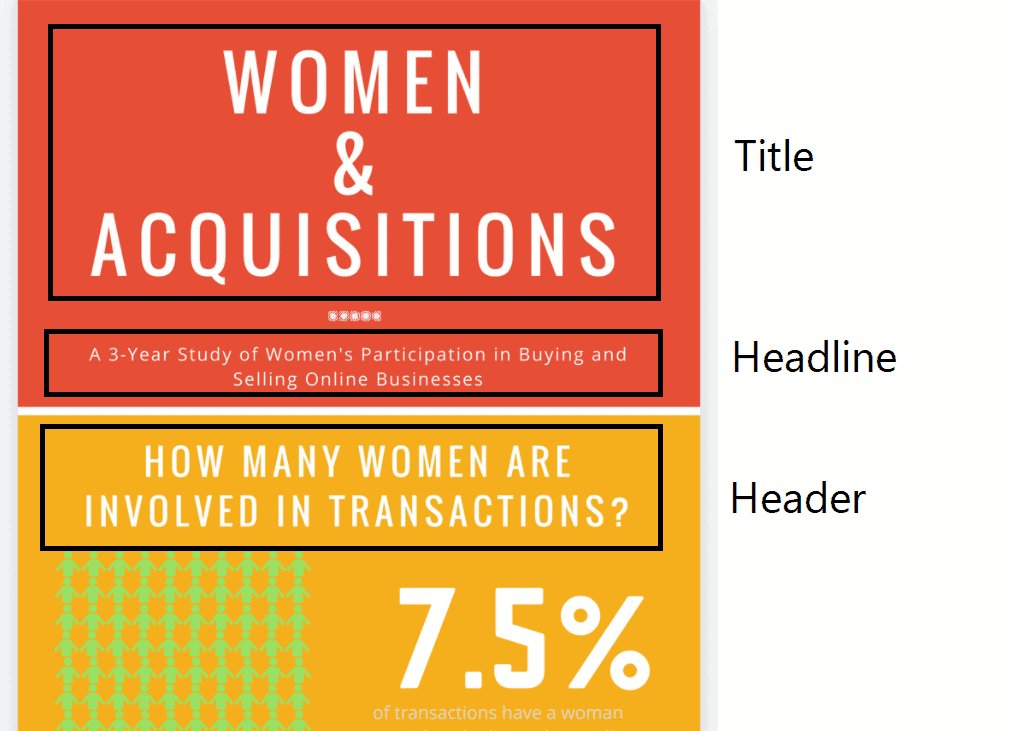
- Title and Headline: Make sure to add the primary keyword in the title and headline of your infographic and make them catchy.
- Headings: You should include keyword variations in the subsequent headers if that makes sense.
- Tone and Voice: Make sure the voice and style of your text are in line with your overall brand voice and personality. That’s crucial for giving your audience a seamless experience across different content types, such as blogs, infographics, and videos, etc.
- Relevance: Make sure the information in the infographic is relevant and within the context of the topic. Otherwise, it will be a massive turn-off for the audience, and search engines won’t rank it high either.
8. Choose a Suitable File Type
Infographics are bulky graphics that can take a long time to load. Page speed is a significant ranking factor in itself. Moreover, when a page takes a long time to load, people tend to lose interest and bounce back to another website. According to research, 1 in 4 visitors leaves a website if it takes more than 4 seconds to load.
It means if your infographic doesn’t load quickly, your bounce rate will jump, and the time people spend on your website will decrease. Both the bounce rate and the dwell time (time spent on your website) are crucial ranking factors.
With this in mind, you must choose a file format that loads quickly. Typically, PNGs, JPEGs, BMPs, and TIFFs load faster. In addition, you can use tools like Tiny JPG to further reduce the image size.
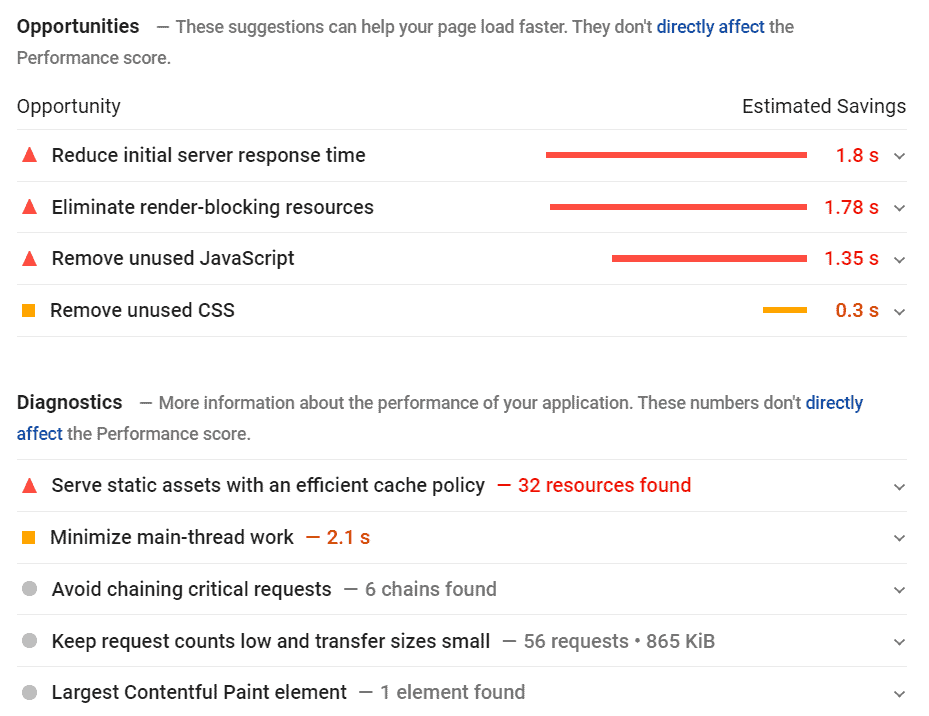
You can check your infographic load time with Google’s free tool. For example, we found this infographic. Let’s enter its URL in the tool.
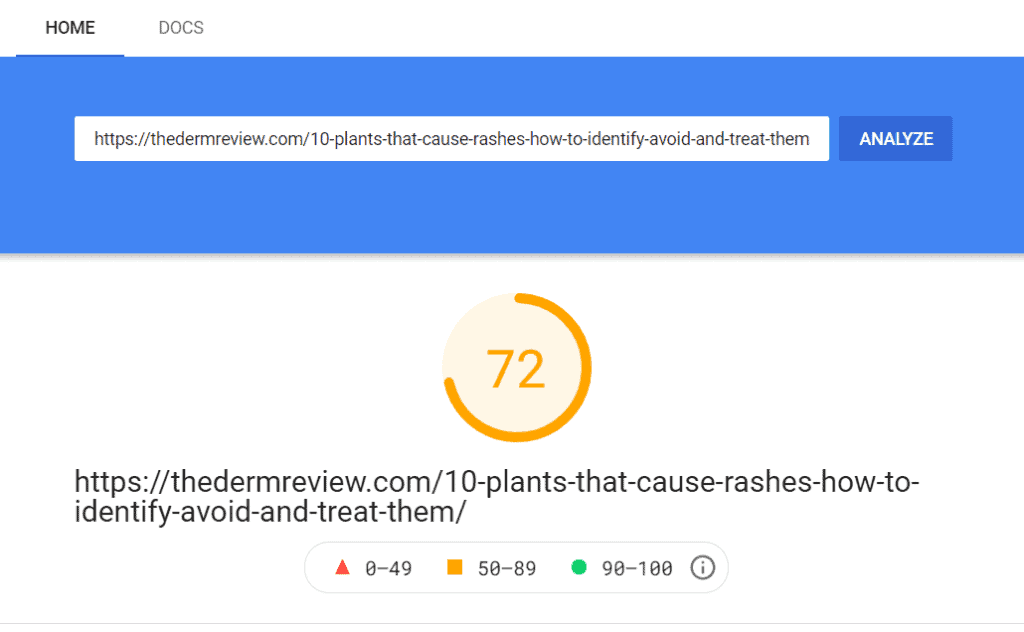
Google has analyzed the page speed as 72, which is pretty good. The report also details ways in which we can improve this speed.
9. Publish and Optimize
We already discussed the importance of optimizing infographic text around the focus keyword. However, once your infographic is ready, you should publish it on your website and optimize the page and the infographic itself for the search engines.
Optimize Infographic for SEO
Here are a few places where you should add your primary keyword to optimize it for SEO.
- Make sure the file name of your infographic image has the main keyword in it.
- Image alt text plays a crucial role in image SEO and should contain your primary keyword or its variation. You can add it easily when you upload it to your website.
- Image URL is another important place to add your keyword because it’s also a ranking factor.
Optimize the Infographic Page
Optimizing the infographic page also helps it rank and bring in organic traffic from search. Here’s a quick rundown of how you can optimize the page where you publish your infographic.

- URL: The URL of the page should contain the primary keyword as it’s an important ranking factor.
- Meta Description: Even though it’s not a decisive ranking factor, meta descriptions play a crucial role in bringing visitors to your website. People read meta descriptions to decide whether they should click on your search result or not. Therefore, you should use your primary keyword or its variation in the meta description because Google highlights it and shows people that your content is relevant.
- Title: Make sure your page title that shows in the SERP has the primary keyword and is written in an enticing way to drive clicks.
- Word Count: Search engines consider word count when crawling the pages and assessing them for ranking. Make sure the word count is above 1000 words to signal that you’ve covered the content in depth.
- Sharing Buttons: Don’t forget to add sharing buttons in a prominent position so that people who visit your website can easily share your infographic with their friends and followers on different platforms. Make infographic sharing as easy and straightforward for them as possible.
- Call-to-Action (CTAs): Always add CTAs in strategic positions to give subconscious queues to people, so they know what to do next.
10. Promote Infographic on Social Media
Once you’ve created an awesome infographic, don’t wait for it to attract the links. No matter how fantastic your infographic is, it’ll need a little more hard work before it can become the link magnet it’s supposed to become.
First, share it with your followers on social media. Since you’ve created the infographic with your target audience in mind, your infographic will undoubtedly create traction with them.
Next, you can choose to use social media ads to get more eyeballs for your content. They charge a little but broaden your reach significantly. With the power of artificial intelligence, these social media platforms allow you to identify your target audience and put your infographic in front of a highly receptive audience.
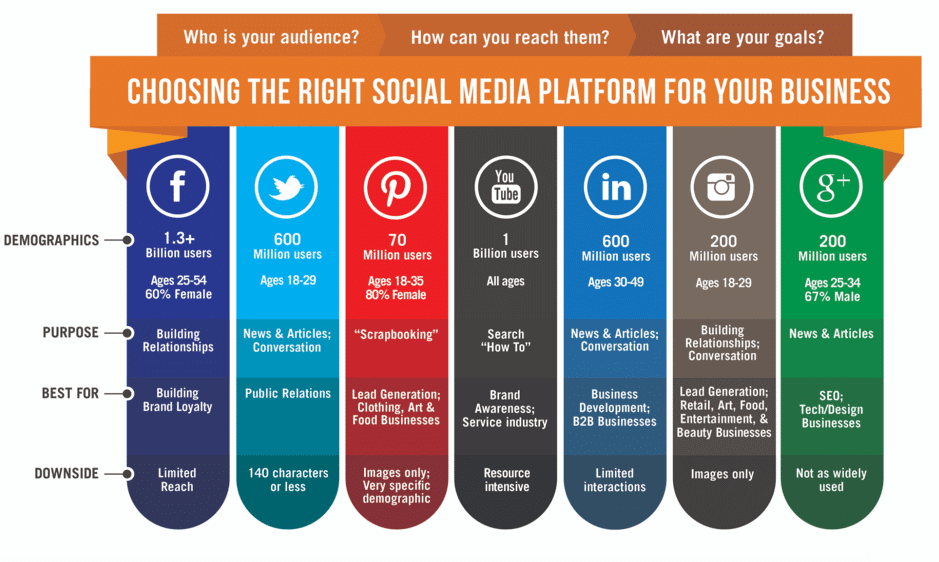
Here are a few of the most important social media platforms for infographic promotion.
- Twitter: Twitter has two superpowers, its highly relevant hashtags and its pay-per-performance ads, which can be incredibly effective in getting you high-quality backlinks. Moreover, most influential people in almost all niches prefer Twitter to communicate with their audience. So your ad will have a better chance at catching their sight.
- Facebook: Facebook’s matchless ad targeting ability makes it the best platform for paid advertisements. Facebook ads are cheap yet highly effective in getting visuals in front of a highly dedicated audience, decreasing your cost per impression.
- Pinterest: Pinterest supports infographics like no other platform. Being a visual search engine, it’s one platform you shouldn’t miss during infographic link-building campaigns.
- LinkedIn: Linkedin Sponsored Content is an excellent tool for generating leads. The paid advertisement on LinkedIn will reach professionals and experts. This means you can receive high-quality backlinks through Linkedin, especially in the B2B domain.

H2: 11. Outreach to Your Linkable Markets
If you’ve designed your infographic with linkable markets in mind, you will have no problem convincing industry experts to share and link to your resources. All you have to do is to inform them of the incredible visual you’ve created.
Create a well-crafted pitch and send it to them. Make sure it’s short and concise. Avoid beating about the bush; be direct. Present your infographic, mention its importance and uniqueness, and how sharing it will affect their audience. Use as few words as possible.
Finally, add a clear call-to-action, i.e. what you want the receiver to do. Here’s a template for a well-crafted pitch you can use for infographic link-building.
Hi [First Name],
I recently read your post on [custom] and [comment/compliment]. Since you often post [custom] I thought you might enjoy this piece that covers [short introduction].
In the visual, we detail [what makes it unique]. For example, did you know that [pick one fact that you think would be interesting to the prospect]?
You can see it here. [URL to the infographic source]
If you think this would be a good fit for [Website name] I’d be thrilled if you share. I’d be happy to write you a custom introduction and/or embed code if that helps make it easier.
All the best,
[Name]
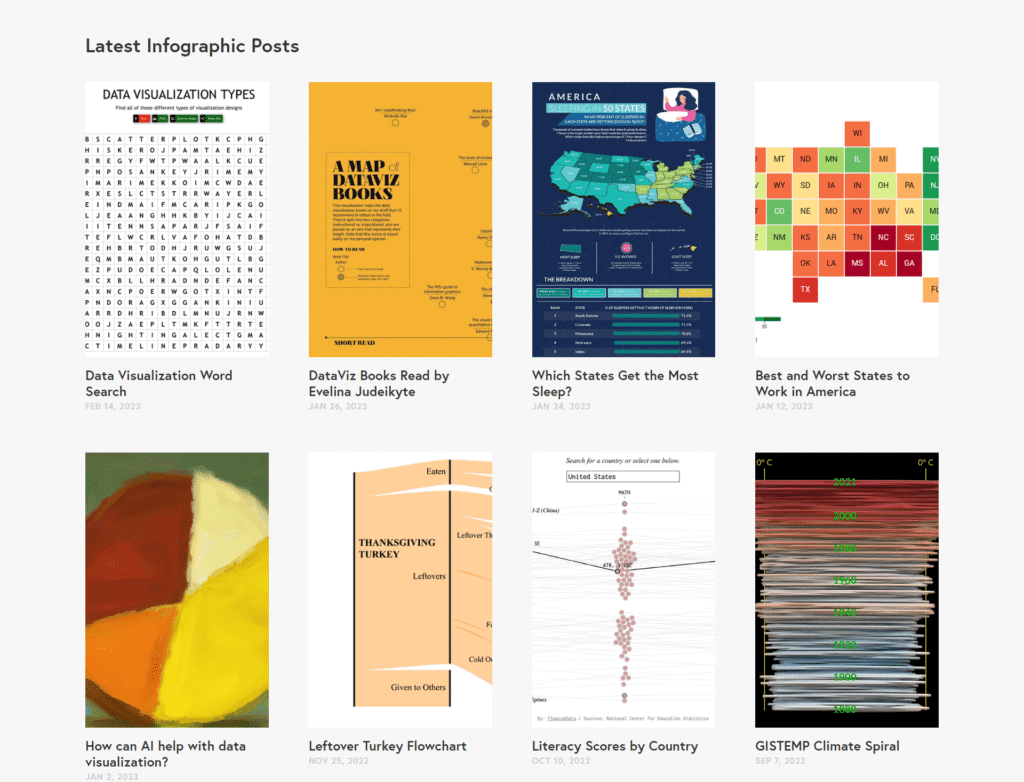
12. Publish on Infographics Directories
Don’t worry! We’re not talking about the old-school (useless) link-building tactic. As long as the directory site is credible and hosts highly informative infographics, you’re good to get along with them.
Infographic directories are a great place to get your infographic published. However, the real goal here isn’t to get a low-quality directory link itself.
These directories are repositories of high-quality infographics on almost all topics. So when someone wishes to quote an excellent infographic to strengthen their article or argument, they head to these directories to find a suitable infographic.
This way, your infographic can have a better chance at getting backlinks from plenty of other websites, of course, if your infographic is informative enough.
13. Contact Influencers in Your Niche
Every niche has some influencers, the people who have a pull with your ideal audience. They may be experts in your field or well-connected with your audience. In any case, what they share and link to is valuable for establishing your authority and getting you precious links.
Do note that the right influencers aren’t only the ones with a considerable following. Here’s how you can find the right influencers for your brand.
- Are they considered an authority in their field?
- Do they have high DR website(s)?
- Does the influencer align with your brand personality?
Once you’ve chosen the right influencer for your brand, send them a pitch inviting them to link and share your infographic. Here’s a template email you can use.
Hey First Name,
My name is [Your Name], and I’m the [Designation] at [Company]. I’m a huge fan of the [Target website], thanks so much for the helpful information!
I recently stumbled across your article [Custom] and [Comment/compliment].
Since you often post about [Custom], I thought you might enjoy this piece that covers [Short introduction]. [Example fact/statistic/info from the infographic.]
You can see it here. [URL to infographic source]
If this feels like a good fit for [Website name], I’d be thrilled if you shared. I’d be happy to write you a custom introduction and/or provide an embed code if that helps make it easier.
All the best,
[Your name]
The best way to reach influencers is to offer value and make sure the collaboration is mutually beneficial.
14. Track Your Backlinks
Many marketers neglect the importance of tracking backlinks but let me tell you why it’s important.
Building SEO infographics and earning links through them takes meticulous planning and a lot of time, effort, and resources. Building links isn’t a one-way process; sometimes, you lose links too for several unintentional reasons.
- The linking website may have deleted your post.
- The website may have updated the post and removed your link.
- They may mess up your URL, so it’s pointing to void.
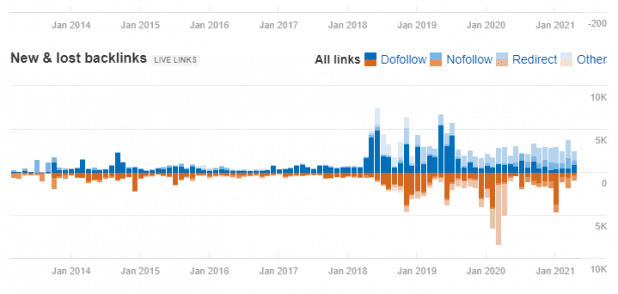
Simply reach out to the webmaster and earn back the broken link. But that’s possible only if you know about it, right?
You can use tools like Ahrefs, SEMrush, or Moz to track your backlinks. It’s also good to perform Reverse Image Search from time to time to find websites that may be using your infographic without linking back to your website. Simply write to their webmasters, thanking them for featuring your infographic and requesting a link back.
Building an SEO infographic that can attract links like a magnet is not an easy task. It requires top-level research, copywriting, and design skills to create a link-worthy infographic. Link-building is the most challenging aspect of SEO. However, when you know the right way to SEO the infographic, they can earn you high-quality backlinks, which are well worth the effort.
Karli is content marketing consultant behind Wild Idea, a content marketing and SEO collective focused on driving big results. With over 12 years in the marketing industry, she’s worked with brands large and small across many industries to grow organic traffic and reach new audiences. She writes on everything from marketing, social, and SEO to travel and real estate. On the weekends, she loves to explore new places, enjoy the outdoors and have a glass or two of vino!


